Which revenue cycle KPIs show whether your billing is working?
Revenue cycle KPIs are ratios that show where your practice's path from visit to payment loses money, and each one can be recomputed from your own reports. HFMA's MAP Keys, which HFMA publishes as industry-standard revenue cycle KPIs, list 29 of them in five groups (patient access, pre-billing, claims, account resolution and financial management) and apply them to physician organizations and ambulatory providers as well as hospitals. You do not need 29: the seven in the table cover each stage where cash leaks.
Which five numbers show whether your billing company is doing its job?
Clean claim rate, denial rate, A/R days, aged A/R share and net collection rate. Together they show whether claims leave complete, whether payers pay them, how fast the money arrives, how much of it is sitting old, and whether you collect what your contracts allow. Charge lag and cost to collect add two things a billing company does not control alone: how fast your clinicians close their notes, and what the whole process costs you.
Which clean claim rate is on your report?
Ask, because one name covers two measures. The MAP Keys clean claim rate (CL-1) counts claims that pass the claim scrubber's edits with no manual intervention, so it grades the billing software before any payer sees the claim. On this site a clean claim is a claim with no errors or missing information that the payer can adjudicate on first submission, which grades the claim itself. A 98% scrubber pass and a 98% first-submission rate are different results, and your report should say which one it shows.
| KPI | How it is calculated | What a bad month tells you | Who usually fixes it |
|---|---|---|---|
| Charge lag | Charge posting date − date of service, in days | Visits wait for notes or charge entry, so claims start late | Clinicians and charge entry |
| Clean claim rate | Claims adjudicated on first submission without correction ÷ claims submitted | Claims leave with missing or wrong data | Billing team |
| Denial rate | Claims denied ÷ claims adjudicated | Payers refuse claims as billed, and rework grows | Depends on the cause: front desk, coding or billing |
| A/R days | Total accounts receivable ÷ average daily charges | Money takes longer to arrive | A/R follow-up |
| Aged A/R share | A/R older than 90 days ÷ total A/R | Claims are ageing toward filing and appeal deadlines | A/R follow-up |
| Net collection rate | Payments ÷ (charges − contractual adjustments) | You collect less than your contracts allow | Billing team and practice manager |
| Cost to collect | Total revenue cycle cost ÷ patient service cash collected | Each dollar collected costs more to bring in | Practice owner |
How can you tell where your practice stands?
Compare with your own earlier months first, published figures second. Signs that need a closer look: A/R days rising while charges stay flat, a growing aged A/R share, denials piling up in one payer or one cause, net collection rate falling after a staff change, or a report whose formulas changed without notice. One data rule from the MAP Keys applies to any practice: unless the processing system changes, the same sources must be used each month.
Many published figures trace to 7 KPIs providers should be tracking, an article published as sponsored content on HFMA's site. It speaks to hospital leaders in places, attributes several numbers to trade press, and ends with an author's note that the benchmarks are general guidelines that vary by specialty, geography and payer mix. The table lists each figure with the question to ask before you compare your number with it. To put your own A/R days next to them, run your totals through the A/R days calculator. The net collection rate calculator does the same for collections.
How do you tell a bad month from a real problem?
Check what entered or left the numbers before you act on a move: a new provider or location, a batch of old claims worked off, large adjustments that cut A/R without any cash, or a payer that changed its rules. Then look at the same KPI by payer, because payer mix alone moves denial rates. A KFF analysis of federal transparency data released by CMS found that HealthCare.gov insurers' in-network denial rates ranged from 1% to 54% in 2023. Payers also make mistakes: HHS-OIG found that 18% of the payment requests that 15 of the largest Medicare Advantage organizations denied in its June 2019 sample met Medicare coverage rules and the plans' billing rules. Treat a move as a problem when it repeats the next month or sits in one payer, provider or denial cause. To find the stage where it starts, see where a practice's revenue cycle leaks and what to fix first. If the worry is old claims, what to do about A/R over 90 days covers which claims can still be collected.
| KPI | Published figure | Source | Check before you compare |
|---|---|---|---|
| A/R days | 30 to 40 days | Sponsored article on HFMA's site | It averages 12 months of gross charges; your report may use a shorter window |
| A/R over 90 days | Less than 10% (self-pay: less than 30%) | Sponsored article on HFMA's site | Physician A/R ages from the date of service in the MAP Keys |
| Clean claim rate | 98% | Sponsored article on HFMA's site, citing Becker's ASC Review | Its formula does not say which clean claim meaning it uses |
| Net collection rate | At least 95%; 97% to 99% optimal | Sponsored article on HFMA's site | Payments must be matched to the charges they pay |
| Denial rate | Average between 5% and 10%; less than 5% optimal | Sponsored article on HFMA's site | Counted in dollars there; the MAP Keys count claims |
| Denial resolution | 85% of denials resolved within 30 days | Sponsored article on HFMA's site | Define resolved: paid, written off or closed |
| Charge capture | Within 3 to 5 days; late charges no more than 2% | Sponsored article on HFMA's site | The MAP Keys count a charge as late from day 4 |
| In-network denial rate (insurer-reported) | 20% in 2023; insurers ranged from 1% to 54% | KFF, from federal transparency data released by CMS | HealthCare.gov plans only; medical and drug claims combined |
Who should produce your KPI report?
You have four ways to get these numbers each month. Each is only as reliable as its written definitions and its link to claim-level data, so ask who checks the numbers against the claims.
For the wider trade-off between keeping billing in-house and outsourcing it, see what in-house billing costs against outsourcing.
| Option | What it costs | Who does the work | What can go wrong |
|---|---|---|---|
| Your staff pull reports from your practice-management system | Staff hours each month; no added fee | Your biller or office manager | Formulas drift when staff change, and nobody tests the numbers against claims |
| The dashboard built into your EHR or billing software | Part of, or added to, your software subscription | The software; your staff pick the filters | The screen may not show its definitions, such as line or claim counts |
| Your billing company's monthly report | Included or extra, depending on the contract | The billing company | The team doing the work grades its own work unless you get formulas and claim-level backup |
| An outside review or audit | A separate fee | An outside reviewer | A one-time snapshot that does not fix the claims behind the numbers |
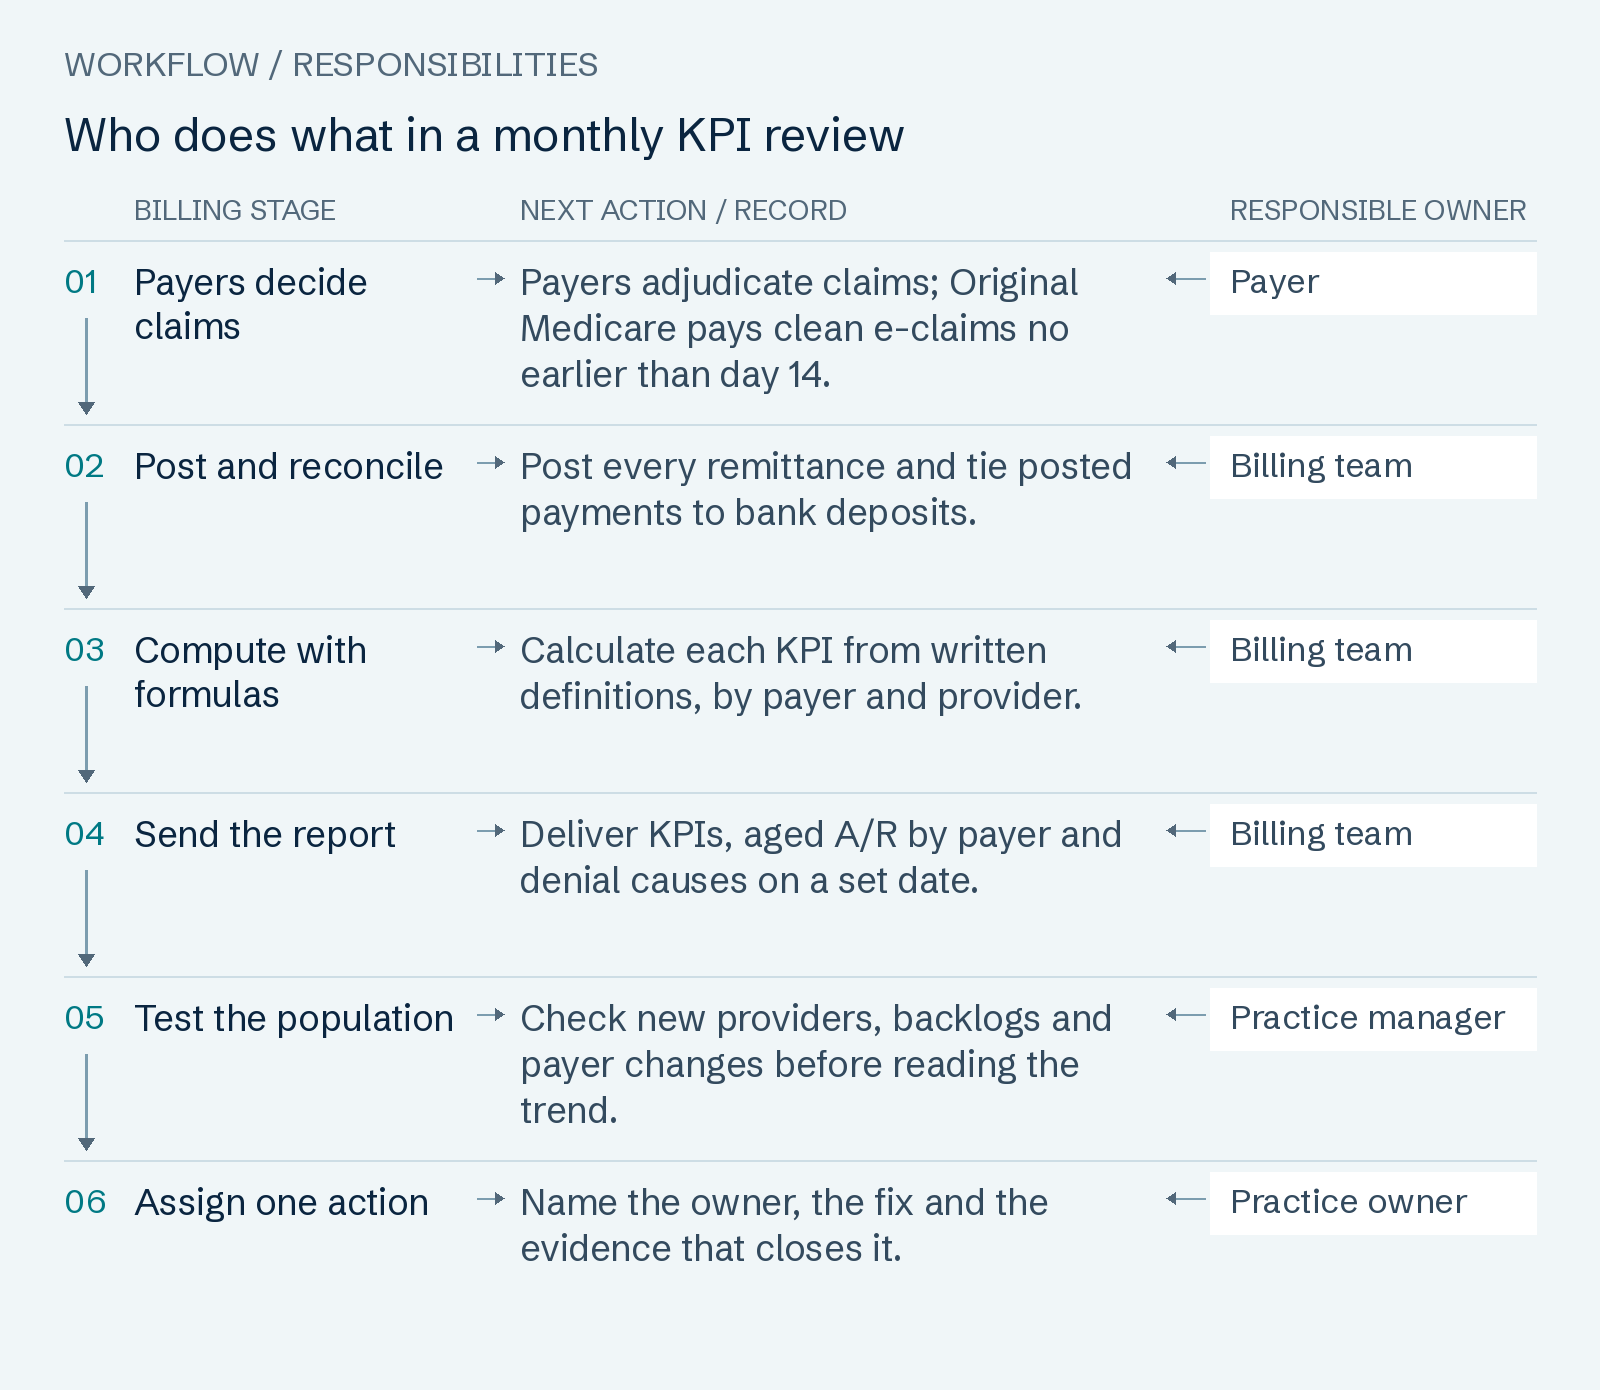
Read the workflow as text
- Payers decide claims — Payers adjudicate claims; Original Medicare pays clean e-claims no earlier than day 14. Owner: Payer.
- Post and reconcile — Post every remittance and tie posted payments to bank deposits. Owner: Billing team.
- Compute with formulas — Calculate each KPI from written definitions, by payer and provider. Owner: Billing team.
- Send the report — Deliver KPIs, aged A/R by payer and denial causes on a set date. Owner: Billing team.
- Test the population — Check new providers, backlogs and payer changes before reading the trend. Owner: Practice manager.
- Assign one action — Name the owner, the fix and the evidence that closes it. Owner: Practice owner.
What should your monthly billing report show?
Ask for these eight items every month, whether the report comes from your own staff or a billing company. Anything missing is a question to put in writing.
- Each KPI with its written formula: numerator, denominator, period and exclusions, so you can recompute it.
- The same sources as last month, or a note saying what changed and why.
- Rejections and denials counted apart. A rejection fails front-end or clearinghouse edits and never reaches adjudication; a denial is an adjudicated claim the payer will not pay as billed. They have different fixes.
- Denial rate by payer and by cause, stated as claims or dollars. The MAP Keys remittance denial rate counts whole claims and leaves out patient-responsibility and duplicate-claim denials; the sponsored 7 KPIs article on HFMA's site divides denied dollars by submitted dollars. Which denial causes to fix first starts from that payer and cause split.
- Aged A/R by payer, with the claims nearest their filing deadline listed. Limits differ widely: our timely-filing dataset records 12 months from the date of service for Original Medicare and 90 days for Cigna Healthcare's commercial plans (participating providers; longer where state law or the provider agreement allows). The full list is in filing limits by payer.
- Posted payments reconciled to bank deposits for the month, with any gap explained.
- What changed in the population: new providers, locations or payers, backlogs and write-off batches.
- One owned action per miss: who fixes it, by when, and what evidence closes it.
Should your billing report match what reaches your bank account?
Total payments posted in a month should tie to that month's deposits. The KPIs will not match deposits, by design. Net collection rate matches payments to the charges they pay, as the sponsored article on HFMA's site defines it, so cash for older claims sits outside it. Cost to collect uses all patient service cash collected in the month, net of refunds. Timing adds a lag: under the Medicare Claims Processing Manual, chapter 1, section 80.2, Original Medicare may not pay a clean HIPAA-compliant electronic claim before the 14th day after receipt and must pay or deny it within 30 days. Those clocks apply to Original Medicare only, not to Medicare Advantage or commercial plans.
Which billing numbers should you review with your physicians?
Charge lag, denials caused by documentation, and each clinician's share of open A/R. The MAP Keys treat a charge posted more than three days after the service as late, and the sponsored article on HFMA's site puts charge capture within three to five days. Show each clinician their own numbers next to the practice total: a per-provider view finds the one chart backlog that a practice-wide average hides.
What does KPI reporting cost your practice?
Reporting costs staff time or a fee, and a number nobody reads can let claims slip past a filing deadline. The MAP Keys cost to collect definition, updated in August 2025, puts the whole bill in one ratio. Its cost side includes salaries and fringe benefits, management vendors, subscription fees, outsourced arrangements, contingency fees, transaction fees and IT support; the divisor is the patient service cash collected in the month. Use it to compare options on one basis: staff cost plus software and clearinghouse fees in-house, against a billing company's fee plus whatever you still pay.
With us, a KPI report with written definitions is part of Full-Service Billing, priced at 5.0% to 8.5% of insurance payments. Your fee is a percentage of insurance payments posted on claims we submitted or worked, net of payer recoupments and refunds. We take 0% of patient payments, copays and anything your front desk collects. Invoices 1–3: only percentage fees on that month's insurance payments, plus any statements or add-ons you order; the $400 minimum starts with invoice 4. Rates by specialty and practice size are on our pricing page.
When should you hand KPI reporting to a billing team?
Hand it off when nobody in your practice owns the formulas, when the report arrives late or changes a definition without a note, or when nobody can give you claim-level backup for a number. Our revenue cycle management service is built for that handoff: by the 10th of each month you get charge lag, clean claim rate, rejection rate, denial rate, A/R days, aged A/R share and net collection rate, each with its written formula, plus your top denial causes, each with its fix. To see where your practice stands first, send a claim-level aging export for The Free A/R Deadline Map: A claim-by-claim list of every unpaid insurance claim over 90 days in the aging report you send: payer, amount, the deadline it faces, the denial reason and the next action, sorted by deadline. Clock starts with your claim-level aging export and signed BAA; above 10 requests in a week, we confirm your date within 1 business day.
Common questions
- Which billing numbers should a practice owner review every month?
- Clean claim rate, denial rate, A/R days, aged A/R share and net collection rate, each split by payer. Add charge lag if notes run late, and cost to collect when you compare in-house billing with a billing company.
- What reports should our billing company send every month?
- A KPI report with each formula written down, aged A/R by payer with the claims nearest their filing deadline, denials by payer and cause, posted payments reconciled to deposits, and the actions taken on last month's misses. Ask for claim-level backup for any number, so you can test it yourself.
- Can my staff produce these KPIs from our practice-management system?
- Yes, if the system reports charges, payments, contractual adjustments, aged A/R and denials by claim. The risk is consistency: the MAP Keys rule is that the same sources must be used each month unless the processing system changes, so write the formulas down and keep them when staff change.
- Do we need a revenue cycle KPI dashboard, or is a monthly report enough?
- Either works if the definitions are written down and the numbers tie back to claims. A dashboard displays numbers; it does not tell you whether a denial rate counts claims or dollars, or whether clean claim rate means a scrubber pass or payer adjudication. Ask for the definitions before you trust the chart.
- Should we compare our numbers with published benchmarks?
- Second, after your own trend. Many published figures trace to a sponsored article on HFMA's site whose author's note says they are general guidelines that vary by specialty, geography and payer mix. Your first month on written definitions is your baseline; compare later months with it, payer by payer.
- What happens if our billing company will not show its formulas?
- You cannot verify or trend its numbers. Ask for the definitions in writing and for claim-level backup for one month, then recompute one KPI yourself. If that is refused, an independent review of a sample of claims answers the question the report does not.
- How long before a new billing company's numbers mean anything?
- The first full month on written definitions is a baseline, not a verdict. Claim-based KPIs for a month change as pending claims are decided: Original Medicare may not pay a clean electronic claim before the 14th day after receipt and must pay or deny it within 30 days (CMS manual, chapter 1, section 80.2). Recompute each month's claims the following month before you judge them.
Sources and review
Page revised October 7, 2026 · Review contact: Hyder Shah (inquiries@claimpillar.com). The filing-limit examples come from our timely-filing dataset, built from each payer's own manual or provider page (rows retrieved 2026-10-02); every source below was retrieved and checked on 2026-10-07.
- HFMA: MAP Keys (KPI definitions)
- HFMA website, vendor-sponsored article: 7 KPIs providers should be tracking
- CMS: Medicare Claims Processing Manual, Chapter 1 (section 80.2)
- KFF: Claims Denials and Appeals in ACA Marketplace Plans in 2023
- HHS-OIG: Medicare Advantage denials of prior authorization and payment requests (OEI-09-18-00260)