What does your A/R days result say about your practice's cash?
Your A/R days result is the number of days of billing your practice is still waiting to be paid for. A result of 60.0 means your open balances equal 60 days of charges at the average daily rate for the period you entered. The American Academy of Family Physicians (AAFP) defines days in A/R as the average number of days it takes a practice to collect payments due; the lower the number, the faster the practice is being paid.
Unpaid days are a cash problem before they are a billing problem. MGMA puts it plainly: “Payroll and rent come due on schedule whether or not claims have cleared, so every added day of A/R is cash the practice cannot use for current expenses.”
What each extra day of A/R holds back
One day of A/R holds one day of your average charges. The calculator prints that figure as average daily charges; in its example it is $2,000. Multiply it by the days you want to cut to see how much billed money would move from receivables into the bank. The table is example arithmetic. The figures are gross charges: the cash you would actually collect is lower by your contractual adjustments.
A/R days is also an average across every payer and patient balance, so a decent overall figure can hide old claims. Read it beside the share of aged A/R, balances older than 90 days, which our guide to A/R over 90 days covers.
| A/R days (example) | Arithmetic at $2,000 a day | A/R at that level | Less than at 60.0 days |
|---|---|---|---|
| 60.0 (calculator example) | 60 × $2,000 | $120,000 | — |
| 50.0 (AAFP's upper limit) | 50 × $2,000 | $100,000 | $20,000 |
| 40.0 (top of AAFP's preferred range) | 40 × $2,000 | $80,000 | $40,000 |
| 30.0 (bottom of AAFP's preferred range) | 30 × $2,000 | $60,000 | $60,000 |
How is days in A/R calculated, using the calculator's example?
Days in A/R is calculated in two steps, and the calculator shows both under its result. We use one definition on every page of this site: A/R days = total accounts receivable ÷ average daily charges. AAFP describes the same order: average daily charges for a period first, then the total receivables divided by the average daily charges.
Step 1: average daily charges
Average daily charges = gross charges posted in the period ÷ calendar days in the period. In the example the calculator opens with, a practice posted $180,000 of charges over 90 days: $180,000 ÷ 90 = $2,000 a day. AAFP's version subtracts credits received from the period's charges first; the calculator takes charges as you enter them, so give it the same kind of figure every month.
Step 2: total A/R ÷ average daily charges
The same practice has $120,000 in total A/R today: $120,000 ÷ $2,000 = 60.0 A/R days. This is an example with round numbers. Run it backward and total A/R = A/R days × average daily charges.
| Step | Arithmetic (example) | Result |
|---|---|---|
| Gross charges in the period | Posted over the last 90 days | $180,000 |
| Average daily charges | $180,000 ÷ 90 days | $2,000 a day |
| Total A/R today | From the aging report | $120,000 |
| A/R days | $120,000 ÷ $2,000 | 60.0 days |
| Check: total A/R from A/R days | 60.0 × $2,000 | $120,000 |
Where do your three numbers come from, and what keeps the trend honest?
All three inputs come from reports your billing system already produces: the A/R aging report for total A/R, and a charge or production report for the period's gross charges. Ask whoever does your billing for both figures on the same day each month, counted the same way every month, or the trend moves when nothing in the practice changed. Gross pairs with gross: if charges are gross, total A/R should be at gross balances too.
Which balances can make your number look better or worse than it is?
AAFP flags three balances that distort the result. Credits should come off receivables to avoid a false, overly positive impression of the practice. Accounts sent to a collection agency are written off current receivables, so AAFP suggests calculating A/R days with and without collection revenue. Payment plans that give patients longer to pay can raise A/R days, so AAFP suggests tracking those patients as their own group. Decide each treatment once, write it on the report and keep it.
| Input | Where it comes from | What to keep the same each month |
|---|---|---|
| Total A/R today | A/R aging report: open insurance and patient balances | How credits, collection accounts and payment plans are treated |
| Gross charges in the period | Charge or production report for the lookback window | Posted date or date of service, whichever you chose |
| Days in the period | The calendar days those charges cover (1 to 730 in the calculator) | The same window length every month |
Why does the lookback period change your answer?
The lookback period is the number of days of charges you average, and it moves the result whenever your charge volume changes. AAFP gives three, six or 12 months of charges as example periods, with 30, 90 or 120 days as example divisors. No rule fixes one window; divide by the days the charges actually cover.
The table is our example, not a practice's data. Total A/R stays at $120,000 while charges grew from about $50,000 a month to $70,000 in the last 30 days. A short window weights the busy month, so A/R days looks lower; a long window averages in slower months, so it looks higher. Neither is wrong. The calculator defaults to 90 days, which follows recent volume without swinging on one slow week. If two reports disagree, check their lookbacks before you question the work.
| Lookback (example) | Gross charges | Average daily charges | A/R days on $120,000 |
|---|---|---|---|
| Last 30 days | $70,000 | $70,000 ÷ 30 = $2,333.33 | 51.4 |
| Last 90 days | $180,000 | $180,000 ÷ 90 = $2,000.00 | 60.0 |
| Last 180 days | $330,000 | $330,000 ÷ 180 = $1,833.33 | 65.5 |
| Last 365 days | $630,000 | $630,000 ÷ 365 = $1,726.03 | 69.5 |
Is your days in A/R healthy for a practice like yours?
The one days-in-A/R benchmark we found in a primary source is AAFP's practice-finance guidance: days in A/R should stay below 50 days at minimum; however, 30 to 40 days is preferable. AAFP does not limit it to one specialty. We print no other target because we could not confirm one in a public primary source.
Your own trend is the fairer comparison, because specialty, payer mix, lookback and credit treatment all shift the number. Direction matters too: in a July 28, 2026 MGMA Stat poll with 203 applicable responses, 43% of medical group leaders said days in A/R were about the same as a year earlier, 32% said higher, 22% reported a decrease and 3% were unsure. A hospital figure is a different measure: HFMA explains that net days in A/R uses net patient receivables on the balance sheet, so it does not compare with a practice's gross-charge figure.
How low can A/R days go? The payers' clocks
Payment rules constrain how quickly individual insurance claims can be paid; they do not set one minimum for this practice-wide A/R-days ratio. Under the Medicare Claims Processing Manual, chapter 1, section 80.2.1.2, a clean HIPAA-compliant electronic claim can be paid on the 14th day after receipt at the earliest, and a paper claim not before the 29th day; section 80.2.1.1 requires clean claims to be paid or denied within 30 days, with interest after that. Under 42 CFR 447.45, a state Medicaid agency must pay 90 percent of practitioners' clean claims within 30 days and 99 percent within 90 days, unless CMS grants a waiver. Commercial payers set their own timing. A practice heavy in slow payers may carry a higher A/R balance, which is why AAFP's illustration flags a practice averaging 49.94 days whose Medicaid claims average 75.
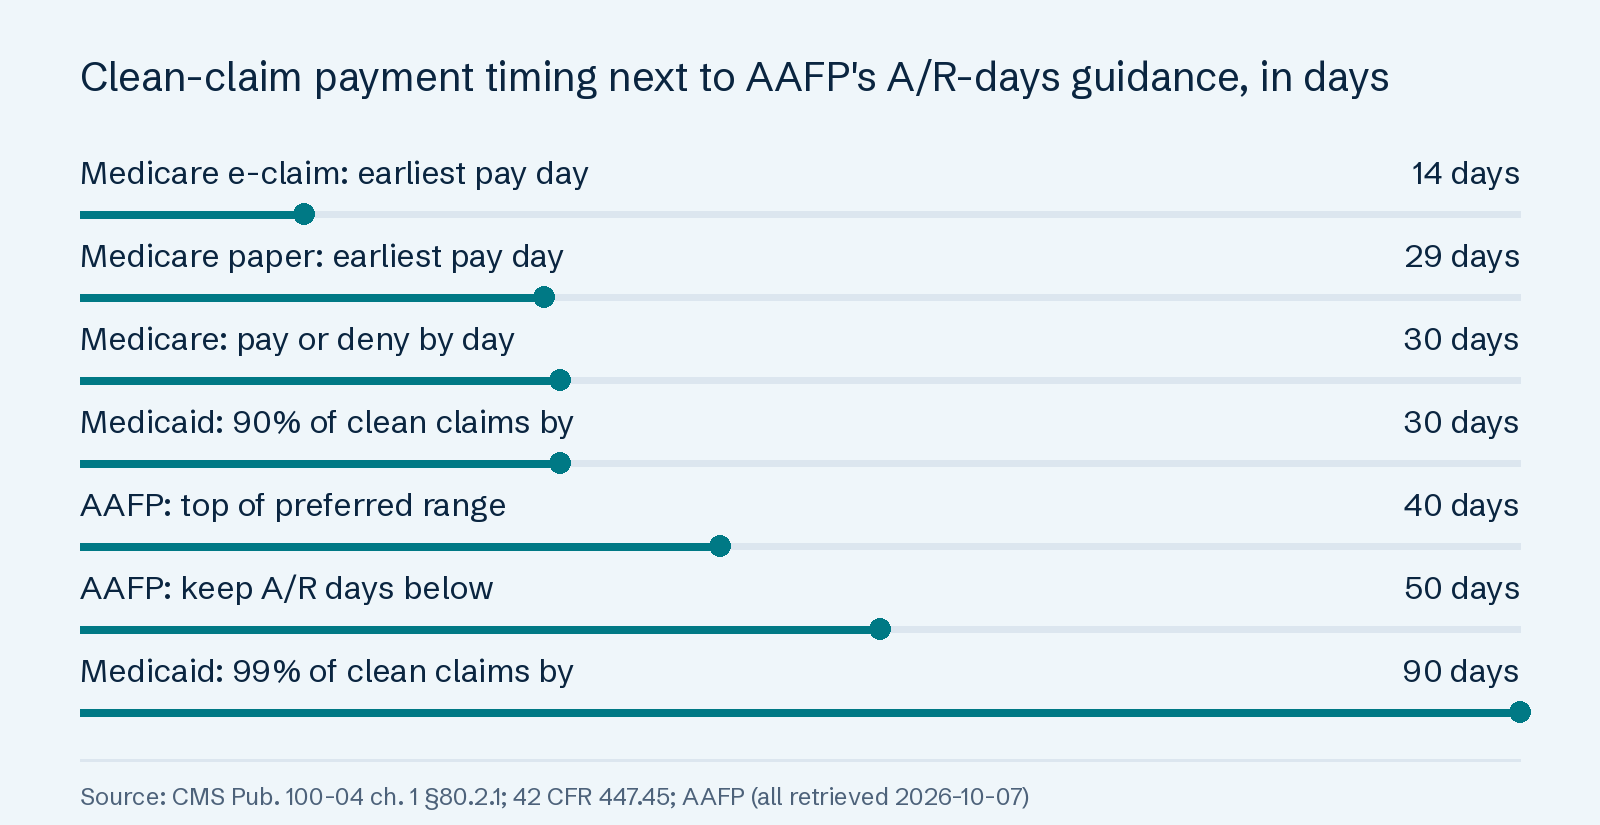
Data table for this chart
| Payer rule | Scope | Days after receipt | Source |
|---|---|---|---|
| Medicare payment floor, electronic | Clean HIPAA-compliant electronic claims | Paid no earlier than the 14th day | CMS Pub. 100-04, ch. 1, §80.2.1.2 |
| Medicare payment floor, paper | Clean paper claims received since 2006 | Paid no earlier than the 29th day | CMS Pub. 100-04, ch. 1, §80.2.1.2 |
| Medicare payment ceiling | All clean claims | Paid or denied within 30 days; interest after | CMS Pub. 100-04, ch. 1, §80.2.1.1 |
| Medicaid agency, first test | Practitioners' clean claims, state agency | 90 percent paid within 30 days | 42 CFR 447.45(d)(2) |
| Medicaid agency, second test | Practitioners' clean claims, state agency | 99 percent paid within 90 days | 42 CFR 447.45(d)(3) |
Why is your days in A/R going up?
Days in A/R rises for three different reasons, and each calls for a different conversation.
- Charges fell. The divisor shrank, not the payments. In our example, if 90-day charges drop from $180,000 to $150,000 while total A/R stays at $120,000, A/R days rises from 60.0 to 72.0 ($150,000 ÷ 90 = $1,666.67; $120,000 ÷ $1,666.67 = 72.0) though no claim paid slower.
- Payers slowed down. Among leaders in MGMA's 2026 poll whose days in A/R increased, payer behavior was the dominant theme: slower payment, initial denials, downcoding, medical-record requests, prepayment audits and long appeals.
- Work stopped inside the practice. MGMA respondents also reported billing-department vacancies and turnover, credentialing delays for new providers and interruptions from changing billing companies, EHRs or practice management systems. MGMA calls practice-side delays more directly addressable: eligibility checks, registration accuracy, unsigned encounters, charge-posting lag, denial follow-up and patient collection procedures.
If the rise started when your biller left, our guide on what to do when your biller quits covers the first 30 days.
What should you ask your biller or billing company each month?
A/R days earns its keep as a monthly trend, counted the same way on the same day. You do not need to calculate it yourself, but you should know what sits behind it. Ask for these each month:
- A/R days, with the lookback and credit treatment printed on the report. If either changed, the trend did too.
- A/R days and aging by payer, not only in total. MGMA recommends running A/R aging by payer to find slow payers before contract talks.
- The share of A/R older than 90 and 120 days. AAFP warns that a good overall figure can mask large balances in older receivables.
- The lag from visit to submitted claim. MGMA suggests clinicians close encounters within 72 hours and staff post charges within two days, against a three- to seven-day lag across the sector.
- What is being done on the oldest claims, and by when. Each one has a filing or appeal deadline; our timely filing guide explains how those clocks run.
Set A/R days beside your other monthly numbers in the revenue cycle KPI set we define. Our net collection rate calculator checks how much of what you are owed is actually collected.
When should you hand the old claims to someone else?
A rising A/R-days figure with a growing 90+ bucket is the sign that old claims need an owner. Which aged claims are still collectible depends on the deadline each one faces. Our A/R recovery service takes over insurance claims 90 or more days past the date of service, dates each one against the filing or appeal deadline it faces, and works them nearest-deadline first until each posts a payment or you approve a write-off.
To see what is at stake first, send us your aging report for a free A/R Deadline Map of every unpaid insurance claim over 90 days, sorted by the date it expires. Clock starts with your claim-level aging export and signed BAA; above 10 requests in a week, we confirm your date within 1 business day. The other free checks are on our medical billing calculators page.
Common questions
- What is a good days in A/R for a medical practice?
- AAFP says days in A/R should stay below 50 days at minimum, with 30 to 40 days preferable (AAFP). We found no federal A/R-days target. Your own trend, counted the same way every month, is the fairer comparison because specialty and payer mix move the number.
- What does each extra day in A/R cost our practice?
- One day of A/R holds one day of your average charges. In the calculator's example that is $2,000, so going from 60.0 to 40.0 days frees $40,000 of billed charges. The cash you actually collect is lower by your contractual adjustments, but the timing cost is real: payroll and rent do not wait for claims.
- Why is our days in A/R going up?
- Check charges first: a slow month shrinks the divisor, so in our example $120,000 of A/R moves from 60.0 to 72.0 days when 90-day charges fall from $180,000 to $150,000. If charges held, look for slower payers, more denials or a gap in billing staff, the causes leaders gave in MGMA's 2026 poll.
- Should days in A/R include patient balances?
- Total A/R includes insurance and patient balances unless your report separates them. AAFP suggests tracking patients on payment plans as their own group, because longer plans raise A/R days, and calculating with and without collection revenue, because accounts sent to a collection agency come off current receivables. Decide once and keep it every month.
- Which period should we use to calculate days in A/R?
- Pick one and keep it. AAFP's examples are three, six or 12 months of charges. In our example, the same $120,000 of A/R reads 51.4 days on a 30-day window and 69.5 days on 365 days because charges grew. The calculator's 90-day default follows recent volume without swinging on one slow week.
- Can we compare our number with a hospital's days in A/R?
- Not directly. HFMA explains that a hospital's net days in A/R uses net patient receivables from the balance sheet, while this calculator uses gross charges. Only figures built on the same inputs and the same lookback compare.
Sources and review
Page revised October 7, 2026 · Review contact: Hyder Shah (inquiries@claimpillar.com). Every source below was retrieved and checked on October 7, 2026. The worked examples are our arithmetic on round numbers, labelled as examples.
- AAFP: Practice Finances and Revenue Cycle Management (days in accounts receivable)
- MGMA Stat: Days in A/R holds steady for most practices, but payer pressure persists in 2026
- CMS Medicare Claims Processing Manual, Pub. 100-04, Chapter 1, §80.2.1.1 (payment ceiling) and §80.2.1.2 (payment floor)
- 42 CFR 447.45: Timely claims payment (Medicaid), eCFR
- HFMA: Ask the Experts, Net Days in A/R