Which free medical billing calculator answers your practice's question right now?
Find your practice's situation:
- Cash arrives later than it used to. Check A/R days: total accounts receivable ÷ average daily charges. Run it in the A/R days calculator.
- Deposits look low for the visits you saw. Check net collection rate: payments ÷ (charges − contractual adjustments). Run it in the net collection rate calculator.
- The same claims keep coming back unpaid. Check your denial rate, payer by payer: claims denied ÷ claims remitted.
- You are weighing a billing company. Compare two quotes in the billing cost guide's quote comparison.
- Claims are aging toward payer deadlines. Find each claim's last filing day with the timely filing guide's deadline calculator.
- Your therapy clinic bills Medicare timed codes. Medicare sets units from the total timed minutes in the day.
What does each check measure, and what result should worry you?
Published reference points, not our targets; compare your number with last month's.
Are we collecting what payers owe?
The AAFP says days in A/R should stay below 50 at minimum, with 30 to 40 preferable. For net collection rate, the AAFP says the adjusted collection rate should be 95%, at minimum; a vendor-sponsored article on HFMA's website calls 97% to 99% optimal.
How many claims do we lose to denials?
HFMA's MAP Keys count denials by claim, not by line, and a vendor-sponsored article on HFMA's website puts the industry average at 5% to 10%, counted there in dollars, not claims. A claim-count denial rate is not directly comparable with that dollar range; compare it with your own earlier months.
What does billing cost per dollar collected?
HFMA's cost to collect counts salaries and fringe benefits, outsourced arrangements and software maintenance, so leaving benefits out makes in-house billing look cheaper.
| Check | Formula | Published reference point | Source |
|---|---|---|---|
| A/R days | Total A/R ÷ average daily charges | Under 50 days; 30 to 40 preferable | AAFP |
| Net collection rate | Payments ÷ (charges − contractual adjustments) | 95% minimum; 97% to 99% optimal | AAFP (95% minimum); vendor-sponsored article on HFMA's website (97% to 99%) |
| Denial rate | Claims denied ÷ claims remitted | 5% to 10% average; under 5% optimal (counted in dollars) | Vendor-sponsored article on HFMA's website |
| Cost to collect | Revenue cycle cost ÷ cash collected | None published on the HFMA pages cited | HFMA (definition) |
Where can you check filing deadlines and compare billing quotes?
Two calculators sit inside the guides that explain them.
- Filing deadline calculator, in the guide to preventing timely filing denials: your start date and a payer's limit give the last day to file. Original Medicare allows 1 calendar year after the date of service; other payers set their own windows.
- Billing quote comparison, in the guide to what billing companies charge: a percentage quote against a flat monthly quote for the same month.
The deadline calculator loads 113 of the 213 rows in our timely-filing dataset as presets: the rows that state one plain limit at high confidence. Tiered, date-limited or "whichever is later" rules and rows with uncertain applicability stay in the dataset for manual entry.
| Payer group | Presets in the deadline calculator |
|---|---|
| Medicaid managed care and CHIP | 36 |
| Commercial and other | 27 |
| Medicaid fee-for-service | 19 |
| Marketplace (ACA) | 12 |
| Medicare Advantage | 13 |
| TRICARE and VA | 5 |
| Original Medicare | 1 |
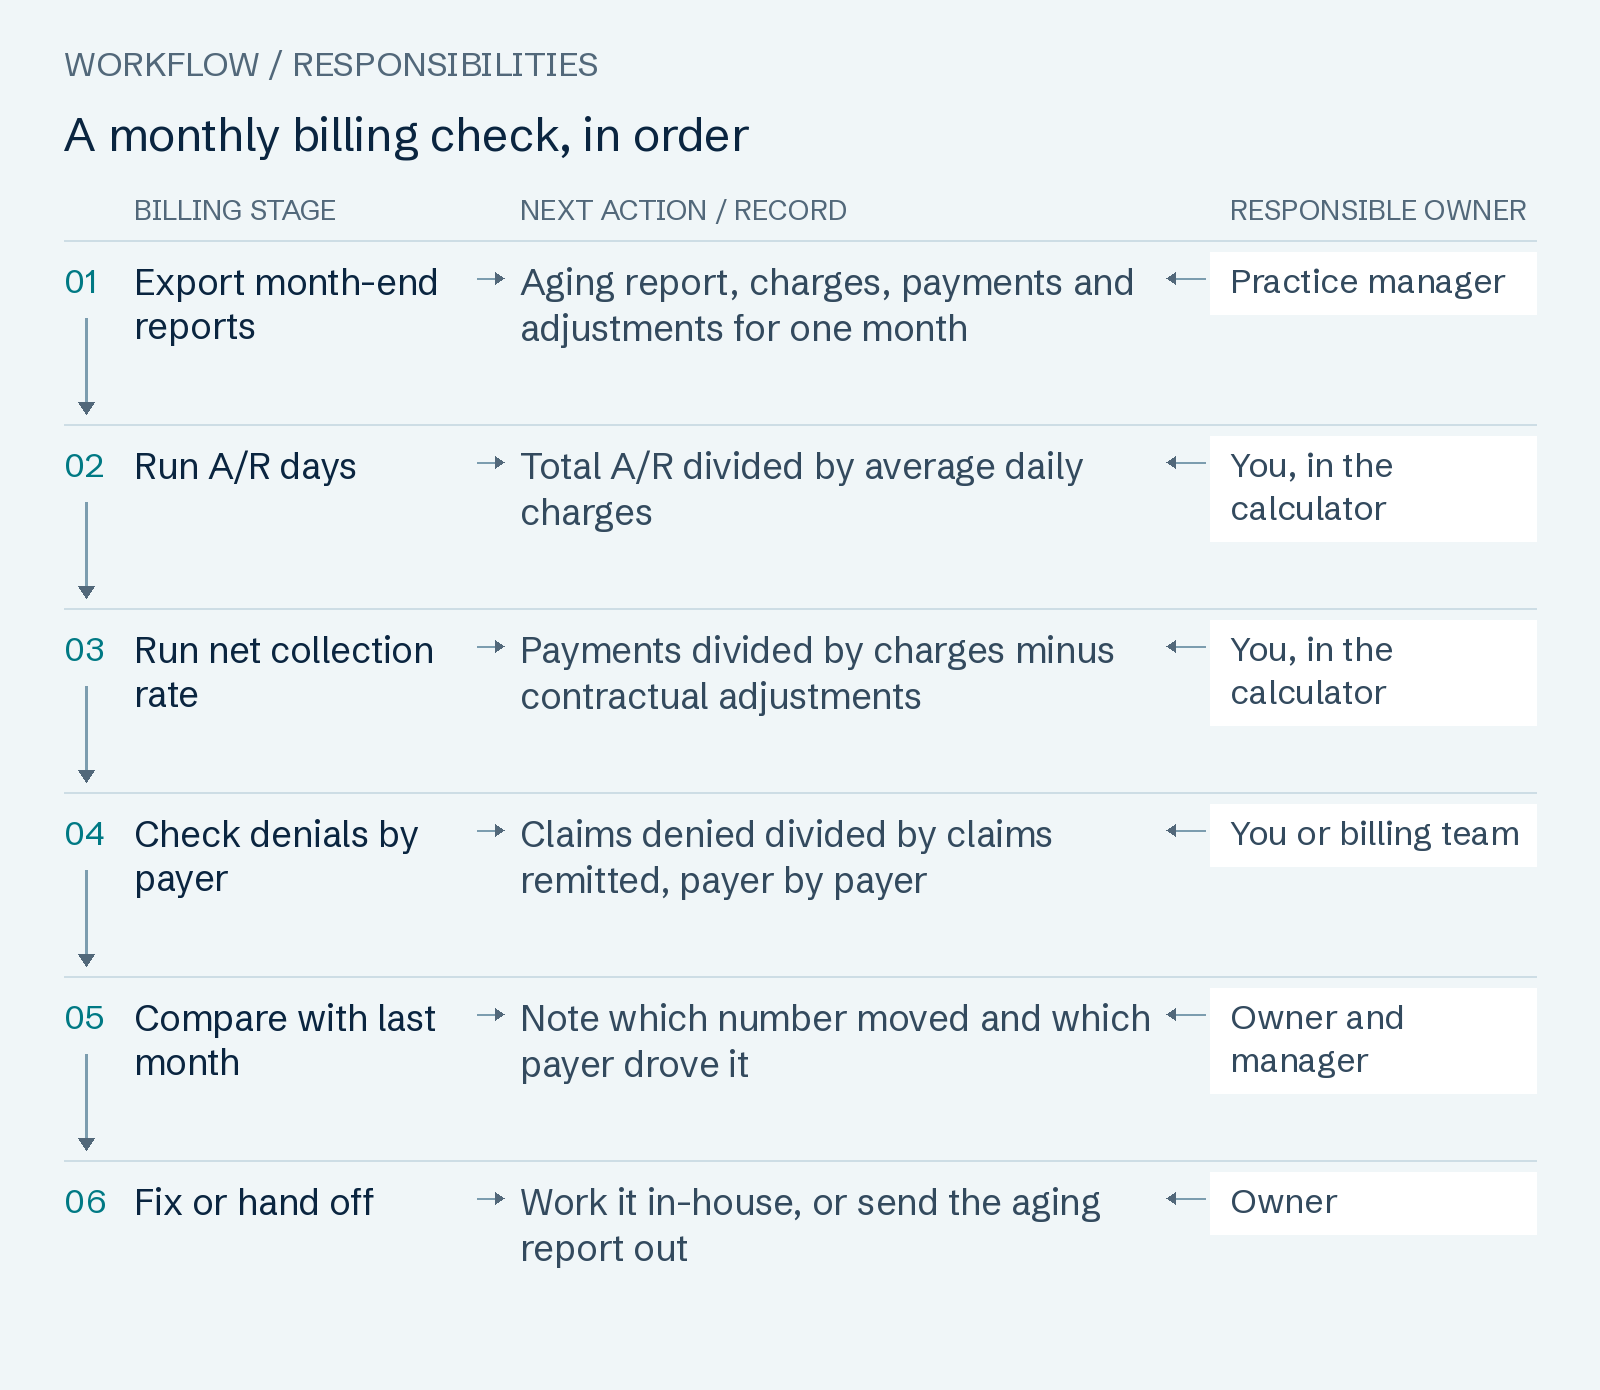
Read the workflow as text
- Export month-end reports — Aging report, charges, payments and adjustments for one month Owner: Practice manager.
- Run A/R days — Total A/R divided by average daily charges Owner: You, in the calculator.
- Run net collection rate — Payments divided by charges minus contractual adjustments Owner: You, in the calculator.
- Check denials by payer — Claims denied divided by claims remitted, payer by payer Owner: You or billing team.
- Compare with last month — Note which number moved and which payer drove it Owner: Owner and manager.
- Fix or hand off — Work it in-house, or send the aging report out Owner: Owner.
What should you check each month, and in what order?
Run the checks from the same month-end reports, in the figure's order. The monthly numbers to ask your billing team for sets out what that report should show.
Which free calculators can you use today?
Calculators publish in stages; this list shows every one live today.
Free calculators
- Days in A/R Calculator for Practices, With BenchmarkEnter total A/R, charges and the days they cover to get your days in A/R, then check it against AAFP's benchmark.
- Net Collection Rate Calculator: Formula and BenchmarksEnter payments, charges and contractual adjustments for the same claims; see your net collection rate and what is still owed.
When do the numbers say to hand billing off?
Hand billing off when the numbers keep worsening and nobody has hours to work the claims behind them. The Free A/R Deadline Map is a free first step for claims over 90 days, delivered in 5 business days. Clock starts with your claim-level aging export and signed BAA; above 10 requests in a week, we confirm your date within 1 business day. Request the A/R Deadline Map.
Or compare aged claim follow-up, denial management and our published rates.
Common questions
- How do I calculate days in A/R for my practice?
- Divide total A/R by average daily charges. Example: $120,000 ÷ ($180,000 ÷ 90 days) = $120,000 ÷ $2,000 = 60.0 days, over the AAFP's 50-day line.
- How do I calculate our net collection rate?
- Divide payments by charges minus contractual adjustments. Example: $85,500 ÷ ($150,000 − $60,000) = 95.0%, the AAFP's minimum.
- What denial rate is normal for a practice like ours?
- A vendor-sponsored article on HFMA's website calls under 5% optimal, counted in denied dollars. Split your rate by payer: one payer's high rate can hide inside a practice-wide figure. Which denial fixes come first starts from that split.
- What does our billing cost per dollar collected?
- Divide total revenue cycle cost by cash collected in the same period, counting salaries, benefits, software and outsourced fees as HFMA's definition does. Example: $9,500 ÷ $95,000 = 10.0%, or 10 cents per dollar.
- Do the calculators keep or send my practice's numbers?
- No. The arithmetic runs in your browser, the calculators store nothing, and they send none of your figures to us.
- Can a calculator tell me whether to outsource billing?
- It shows where your billing stands, not the answer. The in-house vs outsourced comparison weighs a biller's salary against a fee.
Sources and review
Page revised October 8, 2026 · Review contact: Hyder Shah (inquiries@claimpillar.com). Preset counts come from our timely-filing dataset (payer and agency documents retrieved 2026-10-02 and 2026-10-03); reference points are the AAFP's published figures and a vendor-sponsored article on HFMA's website, with definitions from HFMA's MAP Keys, checked 2026-10-07.
- AAFP: Practice Finances (days in accounts receivable)
- HFMA website, vendor-sponsored article: 7 KPIs providers should be tracking
- HFMA: MAP Keys (remittance denial rate AR-5, cost to collect FM-6)
- 42 CFR 424.44: Time limits for filing claims
- CMS Medicare Claims Processing Manual (Pub. 100-04), Chapter 5, section 20.2: timed therapy units
Correction notes
- : Automatic filing-deadline presets now use only high-confidence rows with one filing limit. The full dataset retains rows with uncertain applicability for manual review; selected presets show the recorded source and retrieval dates.